At present, the international situation is changing, the world economy is stumbling, protectionism is prevalent, anti-globalization is surging, and the prospects of global economic growth are full of uncertainty. In particular, emerging economies face greater downward pressure. Therefore, on the basis of in-depth analysis of the economic situation of emerging economies, this paper will analyze the factors affecting the economic trend from the demand side, and look into the future economic growth prospects of emerging economies. Compared with 2017, the year 2018 saw the economic growth of the E11 slip mildly. The proportion of the E11 economies in world economy, based on market exchange or PPP, fell slightly, but their economic scale has continued to expand. Meanwhile, the real per capita GDP growth of the E11 was largely unchanged from that in 2017. From the demand side, we can first have a look at the respective contribution of the three major growth engines in 2018. Although final consumption accounted for a smaller proportion of economic growth of the E11 in 2018, it remains the pillar of economic growth. The proportion of investment also dropped and it has played a diminishing role in promoting economic growth. In most E11 countries, net export of goods and services has played a larger role in boosting economic growth and made a positive contribution to growth. In China, however, its net export of goods and services has played a diminishing role in boosting growth and its contribution to growth was negative. The Composite Leading Index (CLI), Consumer Confidence Index (CCI) and Business Confidence Index (BCI), released by the Organization for Economic Co-operation and Development (OECD) show that in the short term, the economic growth of the E11 economies still faces multiple uncertainties. The possibility is high that growth of the world economy may trend down in 2019, which will spill over to affect the economic performance of the E11. The E11 is on the whole expected to maintain mid- and high-rate growth, but the possibility of their growth rising strongly is slim.
Keywords
This paper would like to choose the E11 as the representatives of emerging economies, and analyze their economic growth. E11 refers to the 11 major emerging-market economies in the Group of 20 (G20), namely, Argentina, Brazil, the People’s Republic of China (hereinafter referred to as China), India, Indonesia, the Republic of Korea (hereinafter referred to as Korea), Mexico, Russia, Saudi Arabia, South Africa and Turkey. The growth rates of world economies have failed to recover simultaneously in 2018. The growth of the emerging economies eased slightly in 2018, with their real per capita GDP growth almost unchanged from 2017. The proportion of the E11 in the world economy, based on market exchange or PPP, slipped moderately, but their overall economic scale has continued to expand. The demand-side analysis of contribution of the three major driving forces for economic growth, i.e., investment, consumption and export, shows that although the proportion of the final consumption expenditures in the E11 economies dropped moderately, they remain the crucial driving force for economic growth; investment is playing a diminishing role in contributing to economic growth; and, with a positive contribution to growth, the net export of goods and services has played a larger role in promoting economic growth in most E11 countries; in China, however, its net export of goods and services has played a diminishing role in promoting growth, and the contribution to quarterly GDP growth was negative. In the short term, the growth of the E11 countries faces a lot of uncertainties, although in the long term, the E11 will maintain the mid- to-high-rate growth trend.
For citation:
Jia Zhongzheng The Economic Growth Prospects of Emerging Economies. Analysis & Forecasting. IMEMO Journal, 2019, no 1, pp. 18-32. https://doi.org/10.20542/afij-2019-1-18-32
THE ECONOMIC GROWTH OF EMERGING ECONOMIES
Compared with 2017, the year 2018 saw the economic growth of the E11 slip mildly. The proportion of the E11 economies in world economy, based on market exchange or PPP, fell slightly, but their economic scale has continued to expand. Meanwhile, the real per capita GDP growth of the E11 was largely unchanged from that in 2017.
1. Economic growth eases slightly
The economic growth rate of the world economy in 2018 was largely unchanged from that in 2017, but the trend of the strong recovery in individual economies, seen in 2017, failed to continue. Except a small number of economies, such as the United States, most individual economies saw their growth rates drop in 2018. Compared with 2017, the economic growth of the E11 was also lower in 2018. Calculation based on IMF data released in January 2019 shows that in 2018, the GDP growth of the E11 was about 5.1% (See Figure 1), slightly lower than their growth rate in 2017, which was 5.2%. Despite their easing growth, the E11 saw their growth rate higher than that of the world economy as a whole and the G20 and much higher than that of the EU and G7. The trend has been close to what we have forecast last year 1, i.e., the trend of the E11 maintaining high-rate growth is expected to continue in 2018 and their growth rate is expected to be largely unchanged from that in 2017 (the GDP growth of the E11 was about 5.1% for 2017, based on data in January 2018), but the possibility of it continuing to rise strongly is big.
Figure 1. Growth rates of major economies in 2009-2018
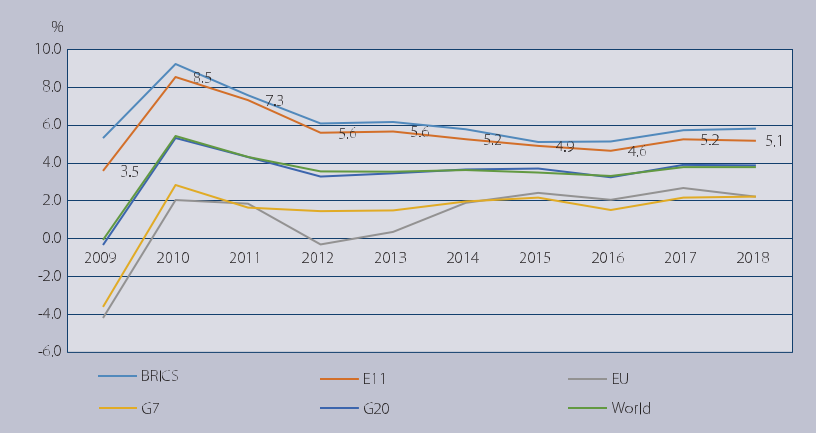
1 The growth rate of each economy group is based on the weighted calculation of PPP-based GDP (current-price) of each economy. The 2018 data are based on estimation.
Sources: 2.
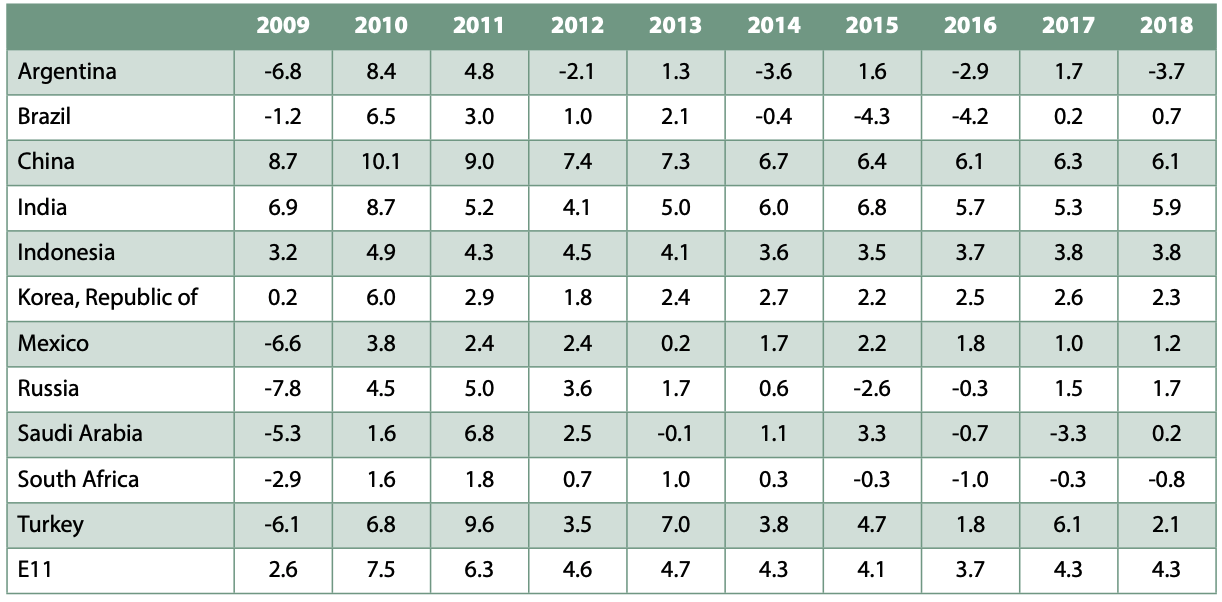
In 2018, growth rate in Indonesia and Mexico remained unchanged from 2017, and most of the E11 economies saw their growth fall (See Table 1). The Chinese economy, which accounts for about 49.1% of the overall scale of the E11 (based on market exchange rate, current-price dollar in 2017) remained stable but there have been some worrisome changes, such as complicated and harsh external environment; faced with downward growth pressure, its GDP growth slipped by 0.3 percentage point to 6.6%, constituting an important factor behind the easing growth of the E11. In 2018, the Chinese economy faced an unprecedented complex situation. External factors include the China-US trade friction, which has escalated and worsened expectations, and the negative impact from the tightening monetary policy stance by the US Federal Reserve. Internally, growth of fixed-asset investment, especially infrastructure investment, fell significantly, the cool-off of the real estate sector as result of consistent tightening of regulatory policies, and the social credit contraction caused by the structural deleveraging measures, as well as the operational difficulties of private enterprises. Those factors have combined to drag on the Chinese economy. In Turkey, its economic growth rate slumped to 3.5% from 7.4%. Its serious currency depreciation, spikes in inflation, continually rising unemployment rate, and expanding current account deficits have been the main causes of the country’s slumping growth. Argentina’s GDP growth fell into the negative territory, slumping to -2.6% from 2.9% in 2017. The exchange rate of the Argentine peso fell by nearly 50% and the country’s inflation rate was close to 50%. Its financing costs hit a historical high (the Central Bank of Argentina raised the benchmark interest rate to 60% in August 2018) and serious drought has dealt a heavy blow to the country’s agricultural output. The situation in Argentina largely matches our last year forecast 1, i.e., it cannot be ruled out that economic recession may occur in some E11 countries in 2018. In Korea, its GDP growth slipped by 0.3 percentage point, mainly due to slowing construction investment as a result of the government’s tightened real estate policies, the China-US trade disputes that have affected its export of intermediate products, long-time consumption on borrowed money that has led to continual rise in household debt levels, and increasingly serious population ageing. And South Africa’s GDP growth slipped by 0.5 percentage point.
GDP growth rates of other E11 countries, however, have risen. India, which accounts for 10.6% of the E11 in terms of economic scale (based on market exchange rate, current-price dollar) rose by 0.6 percentage point to reach 7.3%, which constitutes a major contribution to the overall economic growth of the E11. The Indian government has taken a series of measures to support development of manufacturing, including improving policies for foreign direct investment, attaching more importance to low-cost housing to push development of infrastructure, implementing a slew of policies to support development of textile industry, and providing special support for inter-connectivity in coastal regions. Moreover, its relatively loose fiscal policy, slumping oil prices in recent months and the moderate appreciation of India’s rupee have also boosted the country’s rapid economic growth. Saudi Arabia’s GDP growth rose to 2.3% from -0.9%. Its increasing oil output and development of the non-petroleum economy have played a major role in its growth. In the mid and long term, it is conducive to help the country achieve stable growth to reduce reliance on oil economy and promote development of other industries. Moreover, GDP growth of Brazil and Russia picked up by 0.4 percentage point and 0.2 percentage point, respectively. Thanks to the combined efforts of the E11 countries, in 2018, the economic growth of the E11 eased by 0.1 percentage point.
Table 1. GDP growth rates of the E11 in 2009-2018 (%)
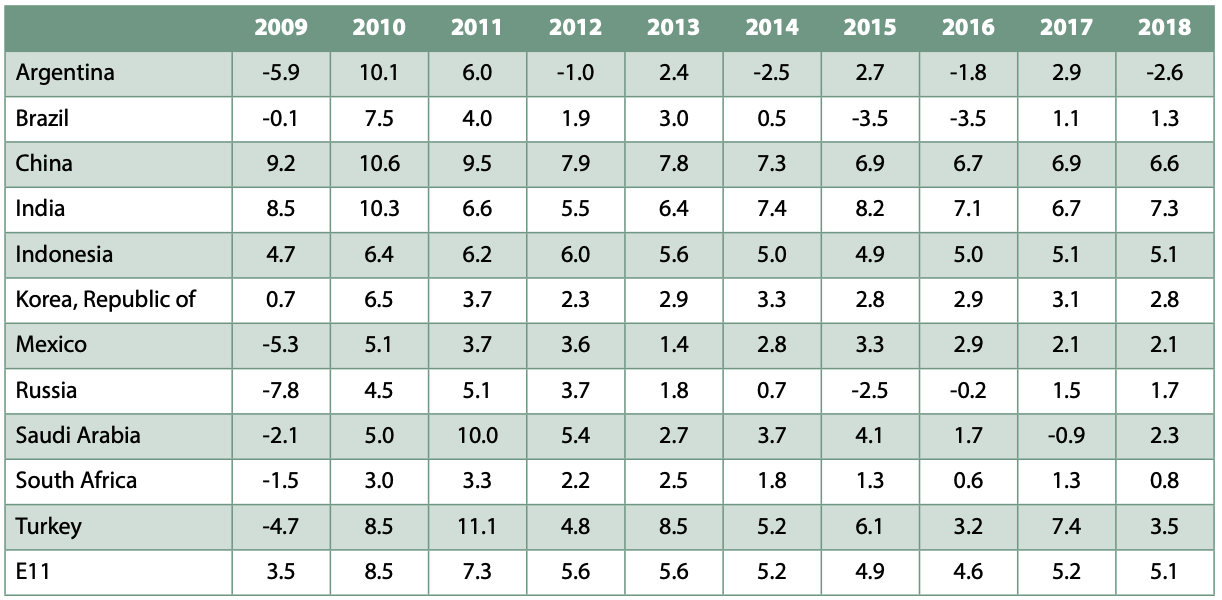
Source: 2.
2. Continual expansion of economic scale and falling relative proportion
The economic scale of the E11 has expanded continually, but their proportion in the world economy has been on the decline. According to the IMF forecast, although the economic scale of the E11 (based on market exchange rate) increased to USD25.8 trillion from USD24.5 trillion in 2017, its proportion in the world economy slipped to 30.4% (See Table 2) from 30.6%. The scale of G7 expanded to USD39.0 trillion from USD36.9 trillion while their proportion fell to 46.0% from 46.1%. The scale of the EU rose to USD18.8 trillion from USD17.3 trillion and its proportion rose to 22.1% from 21.6%. The scale of the BRICS economies expanded to USD 20.0 trillion from USD18.6 trillion and their proportion rose to 23.6% from 23.2%. The scale of the G20 increased to USD73.3 trillion from USD 69.2 trillion, and their proportion rose to 86.5% from 86.4%.
Table 2. Changes in economic scale of major economy groups and their proportion in world economy in 2016-2018 (market exchange rate, current-price, USD billion, %)
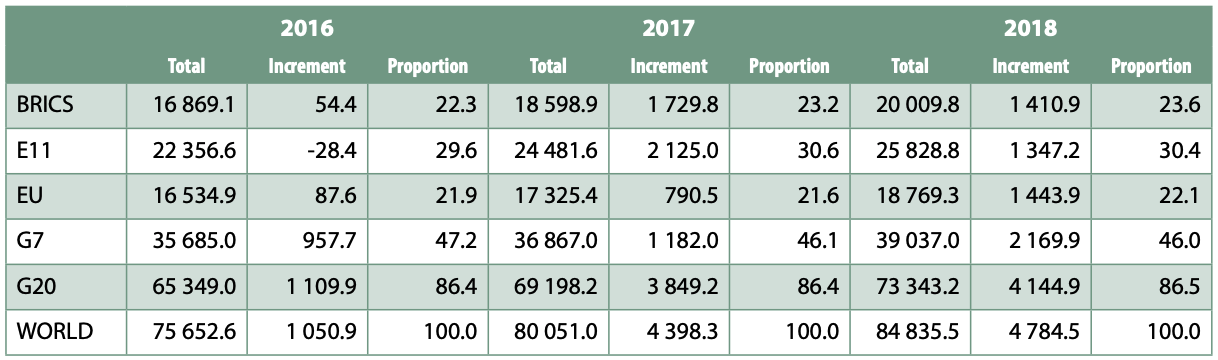
1 Data for 2018 are estimates.
Source: 3.
Calculation of the current-price GDP increment of major economy groups, based on PPP, shows that the economic increment of the E11 has been on the rise and far more than that of G7 and the EU in 2016-2018, although it has accounted for a smaller proportion of the world economy (See Figure 2) From 2016 to 2018, the economic increment of the E11 gradually increased to 4.0 trillion international dollars from 2.7 trillion international dollars while that of G7 and the EU gradually increased to 1.8 trillion and 1.0 trillion international dollars from 0.9 trillion and 0.6 trillion international dollars, respectively. The economic increment of the E11 has been significantly more than that of G7 and the EU. In terms of the proportion of the economic increment of major economy groups to that of the world economy as a whole, in 2018, the proportion of the E11 was 51.8%, down by 0.6 percentage point; that of the BRICS was about 43.2%, up by 0.4 percentage point; that of G7 was about 23.0%, up by 0.5 percentage point; and that of the EU was about 12.4%, down by 1.2 percentage points. Although the relative proportion of the economic increment of the E11 fell, the E11’s economic increment scale is still larger than that of G7 and the EU, and its proportion is still higher than that of other economy groups, indicating that the emerging economies, represented by the E11, remain an important driving force for global economic growth.
Figure 2. Economic increments of major economy groups and the world economy in 2009-2018 (PPP-based, current price)
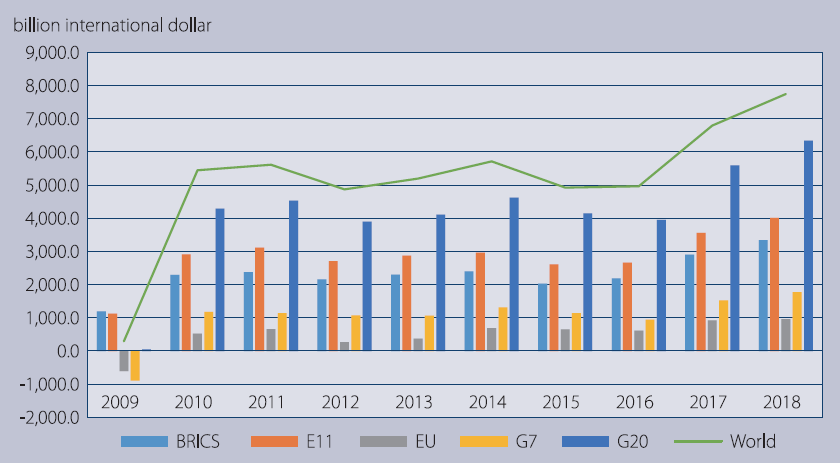
1 Data for 2018 are estimates.
Source: 3.
3. Real growth of per capita GDP largely unchanged
In 2018, the real growth of per capita GDP of the E11 was almost unchanged from 2017, with both of them standing at 4.3% (See Table 3). The real growth of per capita GDP of Brazil, India, Mexico, Russia and Saudi Arabia rose while that of Argentina, China, Korea, South Africa and Turkey dropped. That of Indonesia was largely unchanged. Among countries that saw their real growth of per capita GDP, Saudi Arabia registered the highest growth rate of per capita GDP (3.6%) due to the rapid growth of non-petroleum industries. India’s growth of per capita GDP was the second-highest (0.6%) and Brazil ranked the third place (0.5%). That of both Russia and Mexico was 0.2%. Among countries that have had declining per capita GDP growth, Argentina has the steepest decline (5.4%), followed by Turkey (4.0%). That of South Africa, Korea and China was 0.5%, 0.3% and 0.2%, respectively. According to forecast by office of China’s Central Financial and Economic Affairs Committee, China’s economic scale may reach RMB 90 trillion in 2018, or USD13.7 trillion, based on average USD-RMB exchange rate, with its per capita GDP standing at USD 9.900.
Table 3. Real per capita GDP growth of the E11 in 2009-2018 (%)
1 Real per capita GDP growth of the E11 is based on the weighted calculation of the total of PPP-based, current-price GDP of individual E11 countries. There are slight differences between data in the text of the report and those in the table due to rounding. The 2018 data are estimates.
Source: 3.
THE FACTORS TO INFLUENCE ECONOMIC GROWTH: A PERSPECTIVE FROM DEMAND SIDE
From the demand side, we can first have a look at the respective contribution of the three major growth engines in 2018. Although final consumption accounted for a smaller proportion of economic growth of the E11 in 2018, it remains the pillar of economic growth. The proportion of investment also dropped and it has played a diminishing role in promoting economic growth. In most E11 countries, net export of goods and services has played a larger role in boosting economic growth and made a positive contribution to growth. In China, however, its net export of goods and services has played a diminishing role in boosting growth and its contribution to growth was negative.
1. Final consumption expenditures is pillar of economic growth
The proportion of final consumption expenditures in the E11 economies dropped moderately, but it remains the pillar of economic growth. From 2015 to 2017, the ratio of year-on year final consumption expenditures to GDP in E11 countries fell to 72.2% from 73.4%. In terms of performance of individual E11 countries, Argentina, Brazil and South Africa have had the highest ratio of year-on-year final consumption expenditures to GDP, which were 83.8%, 83.8% and 80.2%, respectively. That of Mexico, Turkey and Russia were 77.6%, 74.2% and 70.4%. The ratios were relatively lower in India, Indonesia, Saudi Arabia, Korea and China, which was 69.8%, 67.0%, 68.4%, 63.9% and 63.3% (See Figure 3). It indicates that final consumption still plays a crucial role in the E11 economy and serves as a sustained and stable growth engine for the E11 countries.
In the E11 countries as a whole (except China), the final consumption expenditures have played a diminishing role in boost economic growth. According to WIND data, the role of final consumption expenditures in boosting the year-on-year quarterly GDP growth has weakened the most in Argentina, whose ratio of final consumption expenditures to its year-on-year quarterly GDP dropped to 4.0 percentage points in the first quarter of 2018 from 4.1 percentage points in the fourth quarter of 2017 and further fell to -3.7 percentage points in the third quarter of 2018. In Russia, the contribution of final consumption expenditures in boosting its year-on-year quarterly GDP growth has also gradually weakened to 1.5 percentage points in the second quarter of 2018 from 2.2 percentage points in the fourth quarter of 2017. In Brazil, the contribution of final consumption expenditures has also weakened and fallen to 1.0 percentage point in the third quarter of 2018 from 2.1 percentage points in the fourth quarter of 2017. In South Africa, the contribution of final consumption expenditures to its year-on-year quarterly GDP has first risen to 1.9 percentage points in the first quarter of 2018 from 1.7 percentage points in the fourth quarter of 2017, before falling to 1.1 percentage points in the third quarter of 2018. Korea has a similar situation, with the contribution of final consumption expenditures to its year-on-year quarterly GDP rising from 2.2 percentage points in the fourth quarter of 2017 to 2.7 percentage points in the first quarter of 2018, before falling to 1.9 percentage points in the third quarter.
China has also seen the contribution of its final consumption expenditures to year-on-year quarterly GDP first rise before falling, but it has been largely on the rise and the rise has been strong. It first rose to 5.3 percentage points in the first quarter of 2018 from 3.1 percentage points in the fourth quarter of 2017 and then fell to 5.0 percentage points in the third quarter of 2018. In terms of contribution of final consumption expenditures to quarterly GDP growth, according to data released by the National Bureau of Statistics of China (NBS), in the first three quarters of 2018, the accumulative ratio of the country’s final consumption expenditures to quarterly GDP growth was 77.8%, 78.5% and 78%, respectively, the first time it has exceeded 75% for three consecutive months since the bureau first started to release the data. The ratios were 46.5, 47.1 and 46.2 percentage points higher than that of gross capital formation. The ratio of services expenditures to GDP growth has risen continually (in the third quarter of 2018, the ratio was 52.6%, up by 0.2 percentage point), constituting a strong and stable buttress for GDP growth and indicating that final consumption expenditures have become the "stabilizer" and "ballast stone" to push China’s economic development.
Figure 3. Ratio of final consumption expenditures of the E11 to economic growth in 2015-2017
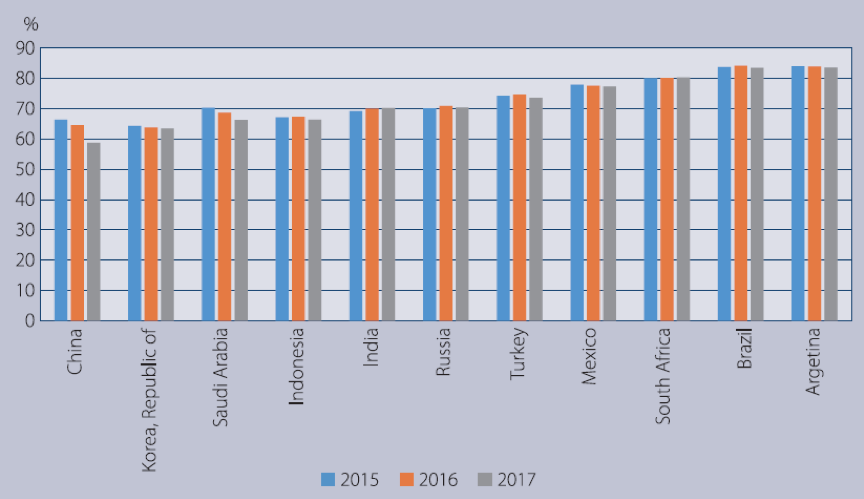
1 Countries are listed based on their 2017 data.
2 China’s data come from the National Bureau of Statistics of China: http://www.stats.gov.cn/english/.
Source: 4.
2. Weakened role of investment in pushing economic growth
The E11 countries, except Argentina, Brazil and India, have seen their gross investment to GDP ratios drop across the board, indicating that the role of investment in boosting economic growth is weakening in the E11. Compared with 2017, the investment to GDP ratio in Argentina in 2018 jumped the most (5.1%) among the E11 countries, followed by India (0.8%). In Brazil, the ratio rose by 0.6 percentage point (See Figure 4). In contrast, the investment to GDP ratio in Russia dropped the most (3.1%) among the E11 countries, followed by Saudi Arabia (1.3%). It fell by 0.6 percentage point in Mexico. The ratio dropped only slightly in Indonesia (0.03%). The ratio was also low in China (0.2%). According to data released by the National Bureau of Statistics of China, from January to October 2018, fixed-asset investment (investment by farmers not included) increased by 5.7%, up by 0.3 percentage point compared with the first three quarters of 2018. It has continued to rise after it stabilized in September. In terms of detailed investment structure, infrastructure investment growth has bottomed out and increased by 3.7% in the first ten months, 0.4 percentage point higher than in the first three quarters. In the future, as China continually implements its policy of "stabilizing employment, finance, foreign trade, foreign investment, investment and expectations", the construction of a series of major projects will be accelerated and the infrastructure investment will continue to be stable. Moreover, industrial transformation, upgrading and innovation have become a major driving force for manufacturing investment growth. China’s manufacturing investment has continued to maintain fast-rate growth, increasing by 9.1% year-on-year, up by 0.4 percentage point compared with the first three quarters, the highest since August 2015. China has stuck to its policy of “houses are for living in, not for speculation” and accelerated the build-up of a housing system that ensures supply through multiple sources and encourages both housing purchases and rentals. As a result, real estate investment growth eased to 9.7%. Besides, thanks to the implementation of policies aimed to boost private investment, such as loosened market access, tax cuts and fee reduction and strengthened protection of property rights, China’s private investment has maintained sound growth momentum, increasing by 8.8% year-on-year in the first ten months, compared with 8.7% in the first three quarters and 5.3% for all types of investment. Compared with advanced economies, such as G7, although the ratio of gross investment of the E11 to their GDP has dropped, it remains at high levels. From 2015 to 2018, the ratio of gross investment of the E11 to their GDP dropped to 27.2% from 27.6% while that of G7 rose to 21.2% from 20.8%. Investment has played a significantly larger role in boosting economic growth in the E11 than in G7 economies.
In terms of the boosting effect of investment on economic growth, gross capital formation of some E11 countries has made a negative contribution to their economic growth. According to data of WIND database, contribution of Korea’s capital formation to its year-on-year quarterly GDP growth gradually dropped to -1.8 percentage points in the third quarter of 2018 from 2.3 percentage points in the fourth quarter of 2017. Russia’s contribution of capital formation to its year-on-year quarterly GDP growth gradually slid to -1.0 percentage point in the second quarter of 2018 from 0.1 percentage point in the fourth quarter of 2017. That of Brazil rose to 1.8 percentage points in the third quarter of 2018 from -0.1 percentage point in the fourth quarter of 2017. That of South Africa has fluctuated and rose to 0.7 percentage point in the third quarter of 2018 from 0.4 percentage point in the fourth quarter of 2017. China’s gross capital formation contributed to 1.7 percentage points of the year-on-year GDP growth in the fourth quarter of 2017 and it rose to 2.1 percentage points in the third quarter of 2018. In terms of contribution of capital formation to GDP growth, according to China’s NBS data, in the first three quarters of 2018, the accumulative contribution of the country’s gross capital formation to quarterly GDP growth was 31.3%, 31.4% and 31.8%, respectively.
Therefore, although the proportion of gross investment in national economic growth has dropped slightly, it remains an important driving force for economic growth.
Figure 4. Ratio of gross investment to GDP in the E11 and G7 in 2015-2018
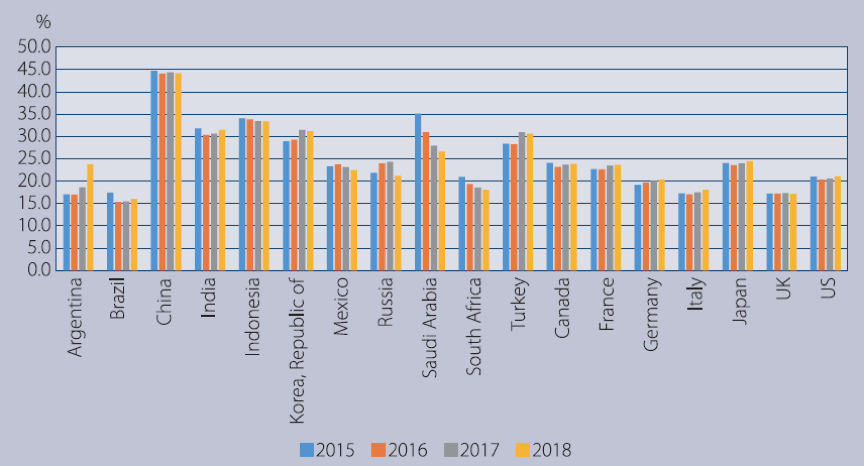
1 Gross investment or capital formation comprises fixed capital formation, changes in inventories and acquisitions less disposals of valuables for a unit or sector. Data for 2018 are estimates.
Source: 3.
3. Contribution of net exports to economic growth increases
In most E11 countries, net exports of goods and services have made a positive and increasing contribution to economic growth. According to data of WIND database, in Argentina, contribution of net exports of goods and services to economic growth rose to 1.9 percentage points in the third quarter of 2018 from -5.8 percentage points in the fourth quarter of 2017. In Brazil, the contribution increased to 1.8 percentage points in the third quarter of 2018 from 1.0 percentage point in the fourth quarter of 2017. In Korea, it gradually strengthened to 2.1 percentage points in the third quarter of 2018 from -1.7 percentage points in the fourth quarter of 2017. In Russia, it was 1.3 percentage points in the second quarter of 2018, compared with -1.9 percentage points in the last quarter of 2017.
In some E11 countries, contribution of net exports of goods and services to economic growth has been negative. In South Africa, it slid to -1.1 percentage points in the third quarter of 2018 from -0.2 percentage point in the last quarter of 2017. In China, it dropped to -0.6 percentage point in the third quarter of 2018 from 2.0 percentage points in the fourth quarter of 2017. In terms of ratio of net exports of goods and services to economic growth, according to data released by the National Bureau of Statistics of China, in the first three quarters of 2018, net exports of goods and services accounted for -9.1%, -9.9%, and -9.8% of year-on-year quarterly GDP growth. Due to the rising protectionism, China-US trade frictions, and diverging performances of the advanced economies, China has faced a worsen external environment, leading to consistently negative contribution of its net exports of goods and services to year-on-year quarterly GDP growth.
TREND OF MID- AND HIGH-RATE GROWTH OF EMERGING ECONOMIES MAY CONTINUE
The Composite Leading Index (CLI), Consumer Confidence Index (CCI) and Business Confidence Index (BCI), released by the Organization for Economic Co-operation and Development (OECD) show that in the short term, the economic growth of the E11 economies still faces multiple uncertainties; but in 2019, the E11 is on the whole expected to maintain mid- and high-rate growth.
The CLI is compiled on the basis of economic data in various fields that are put together based on certain rules. It provides pre-warning signals of business cycle turning at a time of fluctuation of economic activities around its long-term, potential level, and it can be used to anticipate economic trend in the upcoming six to nine months. When the CLI reading exceeds 100, it means the economy expands; when it is below 100, it means the economy contracts. The CLI readings released by OECD show that most CLI readings of the E11 countries have been on the decline and below 100, indicating they may face some challenges in terms of economic growth in the short term (See Figure 5). From the fourth quarter of 2017 to the third quarter of 2018, the CLI of India had kept going up and exceeded 100, rising to 100.9 from 99.7, the only E11 country that had such a strong performance. Thanks to its commodity and service tax reform and the fading of shocks brought by such measures as cash cancellation, plus strong investment and personal consumption growth, India has achieved strong economic growth.
In the first three quarters of 2018, Russia’s CLI had remained above 100 but kept falling, down to 100.4 from 101.0, which was mainly caused by the slumping international oil prices and the escalating sanctions imposed by the US and its allies. In the first three quarters of 2018, Brazil’s CLI was also above 100, but had continually fallen, down to 102.5 in the third quarter from 103.2 in the first. That of China dropped to 98.7 in the third quarter of 2018 from 99.8 in the fourth quarter of 2017. Against the backdrop of continued China-US trade frictions and its structural reforms that have stepped into the “deep-water zone”, China may face some downward pressure in terms of economic growth in the future.
The CLI of Turkey had continued to fall, down to 96.8 in the third quarter of 2018 from 103.6 in the fourth quarter of 2017. It faces worrisome economic prospects due to surging inflation, serious depreciation of lira and soaring unemployment rates and expanding current account deficits. According to results of a Reuters poll, Turkey may face economic recession in the fourth quarter of 2018 and the first quarter of 2019, and the recession could extend beyond the first quarter of 2019. Indonesia’s CLI also fell to 98.4 in third quarter of 2018 from 100.7 in the fourth quarter of 2017 while that of Mexico, Korea and South Africa dropped to 98.7, 99.4 and 99.8 in the third quarter of 2018 from 99.5, 100.6 and 100.3 in the fourth quarter of 2017, respectively. The falling CLI readings indicate that the growth momentum of the E11 may ease and those economies face downward growth pressure in the short term.
Figure 5. CLIs of some E11 countries from Q4, 2017-Q3, 2018
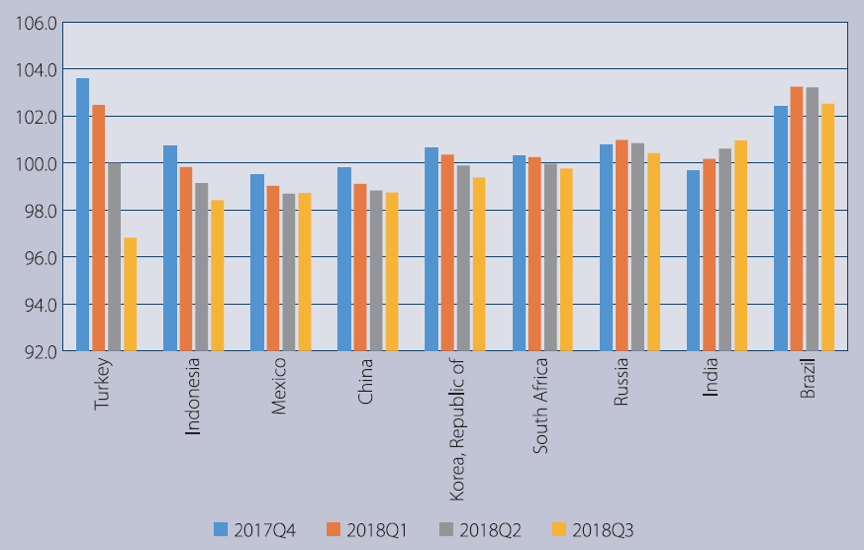
1 Original data are monthly figures and quarterly data are three-month average. Data for Argentina and Saudi Arabia are not available in OECD database. Countries are ranked based on the data of Q3, 2018.
Source: Compiled by the author basing on the OECD data 5.
CCI reflects the subjective measurement of current economic situation and prospects, level of incomes, expectations and confidence of consumers and it is an early-time index to forecast consumption trend and economic tendency in the coming six months. If CCI reading is above 100, it indicates possible improvement of economic climate and prevailing consumer optimism; if CCI reading is below 100, it indicates possible deterioration of economic climate and prevailing consumer pessimism. The CCI readings of the OECD show that people are largely optimistic toward the prospects of most E11 countries (See Figure 6). In the third quarter of 2018, the CCI readings of China, Mexico and Indonesia were all above 100, reaching 103.1, 101.3 and 100.5, respectively. China is transitioning from the phase of high-rate growth to that of high-quality development. Although it faces some downward pressure, it still maintains mid-and high-rate growth. Against that backdrop, China’s industrial structure has continued to improve, which, together with new emerging industries, has increase jobs and jazzed up consumer propensity to spend, making domestic demand the main driving force for economic growth. Russia’s CCI reading rose to 101.0 in the second quarter of 2018 from 100.5 in the fourth quarter of 2017, while that of South Africa rose to 103.0 in the second quarter of 2018 from 98.9 in the fourth quarter of 2017, indicating that their domestic consumers are quite optimistic toward their economic prospects and consumer confidence has improved, jazzing up consumption demand. In contrast, Turkey’s CCI reading dropped to 97.0 in the third quarter of 2018 from 97.2 in the last quarter of 2017; in Brazil, the CCI reading fell to 99.5 in the third quarter of 2018 from 99.9; that of Korea dropped to 99.9 in the third quarter of 2018 from 101.5 in the fourth quarter of 2017, indicating that consumer confidence in those countries has weakened and may affect expansion of their domestic demand in the short term.
Figure 6. CCIs of some E11 countries from Q4, 2017-Q3, 2018
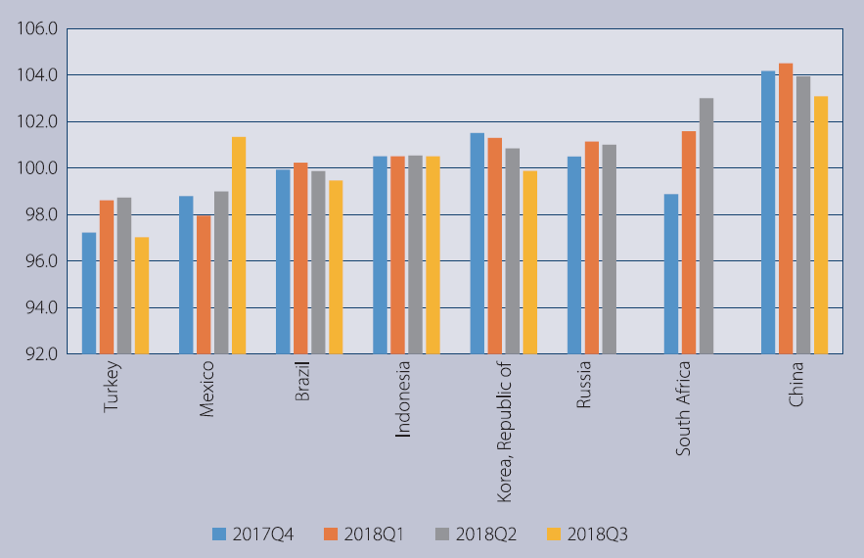
1 Original data are monthly figures and quarterly data are three-month average. Data for Argentina, India and Saudi Arabia are not available in OECD e-library. Data for South Africa are updated to June 2018 and those for Russia are only updated to August 2018, so the figures only reveal the CCI data for the two countries as of Q2, 2018. The rankings are based on data of Q2, 2018.
Source: Compiled by the author basing on the OECD data 6.
BCI reflects the enterprises’ evaluation of future’s economic trend based on its own products, orders, inventory and current conditions and is used to predict corporate operation in the coming six months. If the BCI reading is positive, it demonstrates that the business operation may improve and the majority of enterprises are optimistic about their national economic prospects; if it is negative, it then indicates that the business operation deteriorates and the majority of enterprises are pessimistic about their national economic prospects. The BCI readings released by OECD indicate that BCIs in most E11 countries have dropped (See Figure 7). In terms of performance of individual countries, the BCI readings stayed above 100 in the third quarter of 2018 in Brazil, Mexico and Russia, standing at 100.2, 100.9 and 101.6, respectively; that of Indonesia was also above 100, but it had dropped to 100.1 in the second quarter of 2018 from 100.7 in the fourth quarter of 2017. Comparatively, other E11 countries face a harsher situation indicated by their BCI readings. Korea’s BCI reading dropped continually to 98.5 in the third quarter of 2018 from 99.0 in the fourth quarter of 2017; that of South Africa fell to 98.4 in the third quarter of 2018 from 98.6 in the fourth quarter of 2017; that of China slid to 99.4 from 99.7 and that of India dropped to 99.6 from 99.8 in the same period. Turkey’s BCI reading dropped below the demarcation line of 100 to 96.9 in the third quarter of 2018 from 102.0 in the fourth quarter of 2017. The falling BCI readings show that enterprises of those countries are quite cautious and even pessimistic about their future economic prospects and in the future they may adjust their investment scale and reduce employment, which will combine to affect economic output.
Figure 7. BCIs of some E11 countries from Q4, 2017-Q3, 2018
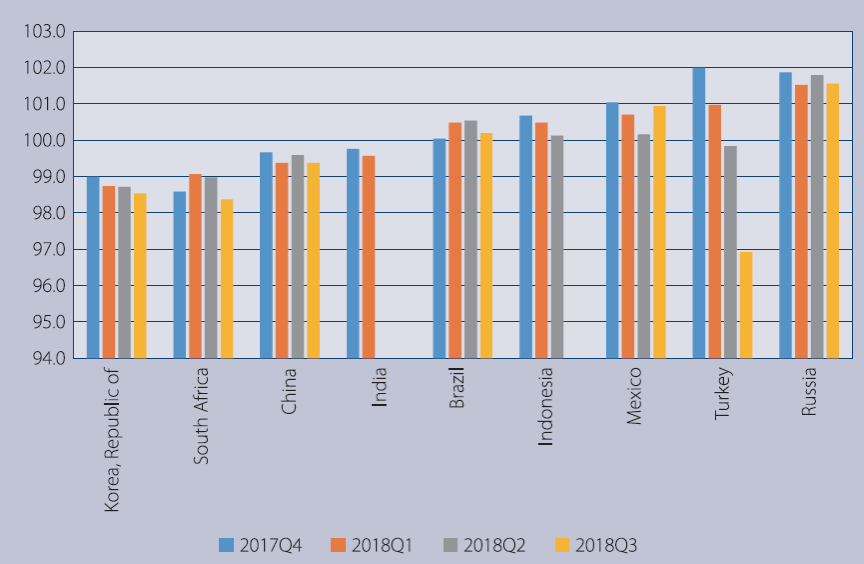
1 Original data are monthly figures and quarterly data are three-month average; data for Argentina and Saudi Arabia are not available in OECD e-library. Data for India and Indonesia are updated to May and June 2018, respectively, so only BCI prints of the two countries in Q1, 2018 and Q2, 2018 are shown. The rankings are based on data of Q3, 2018.
Source: Compiled by the author basing on the OECD data 7.
Looking ahead, the E11 economy is expected to maintain mid- and high-rate growth and remains an indispensable driving force for pushing global economic growth. According to IMF forecasts in January 2019, the GDP growth of the E11 may be kept above 5% during the 2019-2023 period and, compared with 2018, it would fall by 0.1 percentage point to hit 5.0% in 2019 (See Table 4). In terms of performance of individual E11 countries, China’s GDP growth is expected to slide to 6.2% in 2019 and gradually fall to 5.6% in 2023. From the perspective of external demand, given the prevailing protectionism, possibly easing of growth in the US, uncertainties brought by the China-US trade relation and the fragile and slack growth of European and Japanese economies, the global economic growth is expected to slow and fluctuations in the emerging-market economies would intensify, which will further worsen the external environment China faces. From the perspective of domestic demand, it is becoming increasingly difficult for China to strike a balance among the tasks of stabilizing growth, promoting reform, adjusting economic structure, improving people’s livelihood and preventing risks; its demand for consumption and investment may weaken. In the long term, how China will make use of its supply-side structural reform to carry out its “three tough battles” of prevention of major risks, targeted poverty alleviation, and pollution prevention will have a direct bearing on the country’s high-quality development in the future. According to a report of Goldman Sachs, China will face heavier downward pressure in 2019, but considering the new-phase supply-side structural reform, the implementation of the “six stabilization” policy (stabilizing employment, finance, foreign trade, foreign investment, fixed-asset investment and expectations) and the new round of reform and opening-up, market confidence will be effectively restored. Therefore, the report said, China’s real GDP growth could reach 6.3% in 2019.
India’s GDP growth is expected to reach 7.5% in 2019 and be kept at about 7.7% in the coming four years. As the negative effects of the cash-cancellation move by the Narendra Modi government and the goods and services tax reform gradually fade, the reform dividends have started to unfold. In the short term, the Modi government has taken a series of measures to strengthen market confidence, promote manufacturing development and comprehensively reform the foreign investment policies, which have made India one of very good destinations for investment. In November 2018, India’s retail inflation hit 2.33%, the lowest in 17 months; its manufacturing index picked up for 16 consecutive months; new orders surged; and strong demand increased sales. All those signs point to a strong growth momentum of the Indian economy, which will continue to expand in the short term.
From a long-term perspective, strong domestic demand, low-cost labor and relevant systemic reforms will provide solid support for its long-term high-rate growth. The Indian government has also initiated a new development plan, in which it strives to expand its economy to USD 5 trillion by 2025; according to the plan, the services industry will account for 60% of the economy while manufacturing and agriculture account for 20%, respectively. To achieve that target, the Indian government plans to invest USD 1 billion to push development of 12 major service sectors, including information technology service, construction and relevant service, environment service, financial service, legal service, education service, medical service, accounting and auditing service, transportation service, travel and hospitality service, audio and video service and media service, and put forward the new industrial policy to promote manufacturing development. It aims to make its services account for 60% of GDP by 2022, up from 53% in 2015, and make services export account for 4.2% of global services export by 2022, up from 3.3% in 2015. However, the Indian economy also faces some risks and problems. First, its domestic economy has been deeply integrated into the global economy and is quite sensitive to changes in external environment. Given contraction of global demand, the Indian economy cannot go unscathed. Second, its domestic macroeconomic policies, especially monetary policy, may shift to a neutral stance, which will affect its growth. Third, in the upcoming election, if Modi cannot get reelected, the many reforms measures his government has implemented may be stopped or even eliminated by the new government, putting the growth sustainability of the Indian economy at risk.
In 2019, Brazil's GDP growth is expected to reach 2.5%, up from 1.2% year-on-year. According to results of a poll conducted by polling institute Datafolha in late December 2018 before Jair Bolsonaro was to be sworn in as new president, the optimism of the Brazilian people about the country's economic prospects has hit a historical high, with about 65% of respondents expecting the economy to turn for the better in the upcoming months-the highest since 1997 when the poll was first carried out. Moreover, the public also expected the country's unemployment and inflation to improve. In the future, if the new government can reduce public debts, carry out pension reform, punish corrupt officials, push privatization and reform taxation system, Brazil may hopefully step out of the shadow of recession and achieve stable, healthy development in the long term. In Indonesia, GDP growth is expected to reach 5.1% in 2019 and further rise to 5.4% in 2023. Korea's GDP growth is expected to be 2.6% in 2019 and stabilize at that level by 2023. Turkey's GDP growth is predicted to be about 0.4% in 2019, down by 3.1 percentage points year-on-year and it may recover and rise to 2.6% by 2023. In 2019, it is expected that GDP growth of Saudi Arabia, Russia, Mexico, South Africa and Argentina will be 1.8%, 1.6%, 2.1%, 1.4% and -1.6%, respectively.
Table 4. GDP growth rates of the E11 in 2019–2023 (%)
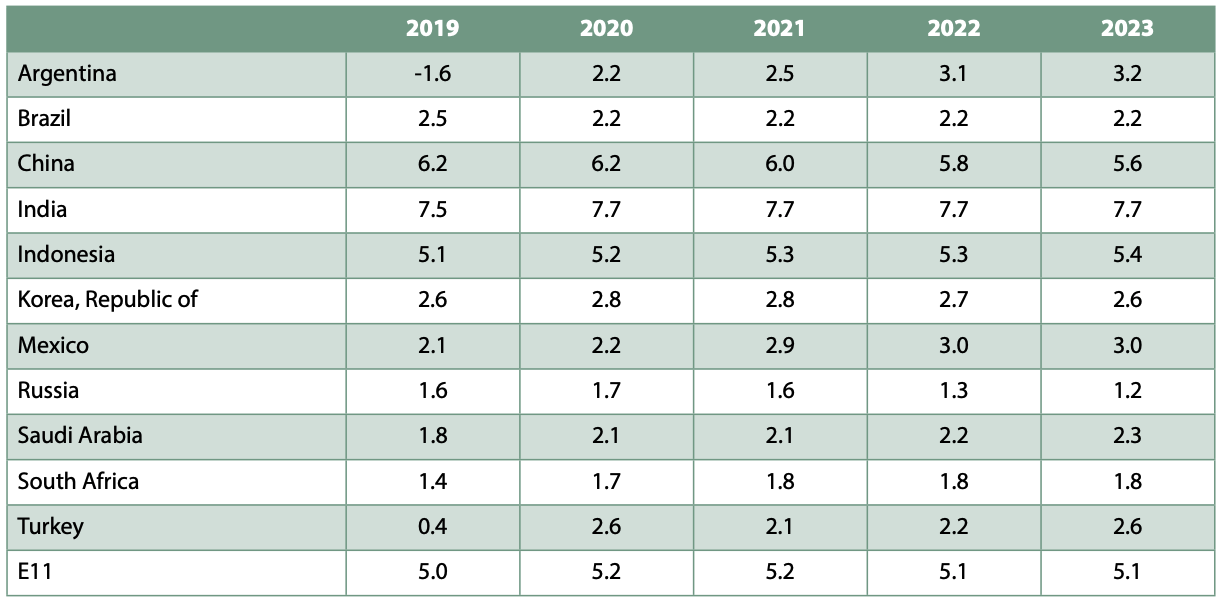
1 Economic growth of each country is the GDP growth rate calculated based on constant prices. Data above are all estimates.
Source: 2.
THE GROWTH PROSPECTS FOR EMERGING ECONOMIES
The possibility is high that growth of the world economy may trend down in 2019, which will spill over to affect the economic performance of the E11. Seen from factors that influence economic growth of the E11, favorable factors include the continual unfolding of dividends of the economic restructuring and deepening reforms in emerging-market economies. For instance, China’s ongoing expansion of economic opening-up to form a new opening-up scenario and India’s great domestic demand, low-cost labor, taxation system reform and revision of foreign investment laws and regulations, which are aimed to attract more international capital, will provide an important driving force for their economic growth. Meanwhile, the E11 economies also face multiple risks and challenges, such as the anti-globalization tide, especially the prevailing trade and investment protectionism, uncertainties regarding the evolution of the China-US trade disputes, the possibility of the US economy starting to weaken, the spill-over effect of the macroeconomic policy adjustments by the developed countries, possibility of further drastic fluctuations in the financial markets, risks caused by accumulation of debts, especially in the private sector, geopolitical risks, and populism. Those unfavorable factors will bring negative impacts on the future economic growth of the E11. Based on the above analysis, we hold that the E11 may continue to maintain their mid- and high-rate growth trend, but the possibility of their growth rising strongly is slim.
References
- Boao Forum for Asia Development of Emerging Economies Annual Report 2018. Beijing, University of International Business and Economics Press, March, 2018. 109 р.
- World Economic Outlook Update: A Weakening Global Expansion. January 2019. International Monetary Fund. Available at: https://www.imf.org/en/Publications/WEO/Issues/2019/01/11/weo-update-january-2019 (accessed 11.11.2019).
- World Economic Outlook: Challenges to Steady Growth. Washington DC, October 2018. International Monetary Fund. Available at: https://www.elibrary.imf.org/doc/IMF081/25350-9781484376799/25350-9781484376799/Other_formats/Source_PDF/25350-9781484377192.pdf (accessed 11.11.2019).
- Global Economic Prospects: Darkening Skies. World Bank. January 2019. Available at: http://documents.worldbank.org/curated/en/307751546982400534/Global-Economic-Prospects-Darkening-Skies (accessed 11.11.2019).
- OECD Composite Leading Indicators (CLI), December 2018. Available at: https://www.oecd.org/newsroom/composite-leading-indicators-cli-oecd-december-2018.htm (accessed 11.11.2019).
- OECD Consumer confidence index (CCI). Available at: https://data.oecd.org/leadind/consumer-confidence-index-cci.htm (accessed 11.11.2019).
- OECD Business confidence index (BCI). Available at: https://data.oecd.org/leadind/business-confidence-index-bci.htm (accessed 11.11.2019).