Life-Cycle Greenhouse Gas Emissions: Battery Electric and Internal Combustion Engine Vehicles
Primakov National Research Institute of World Economy and International Relations, Russian Academy of Sciences (IMEMO), 23, Profsoyuznaya Str., Moscow 117997, Russian Federation.
The article assesses life-cycle greenhouse gas emissions of internal combustion engine vehicles and battery electric vehicles including emissions from production, operation, maintenance, battery replacement and disposal. The author uses data on the carbon intensity of electricity generation in the European Union, USA and China – leaders in global energy transition – to estimate greenhouse gas emissions from the operation of electric vehicles taking into account electricity losses in the grid and during charging. It is shown that low-emission European electricity generation allows electric vehicles to achieve a level of greenhouse gas emissions over their life cycle that is lower than that of traditional internal combustion engine vehicles even with battery replacement and vehicle disposal, but at the same time, in terms of technical characteristics, electric vehicles are inferior to their counterparts. In the USA, due to the displacement of coal generation by gas, the carbon intensity of electricity has decreased, therefore, the use of electric vehicles leads to a decrease in emissions with an exclusion of battery replacement and disposal, but considering the latter, the volume of emissions is already comparable. Moreover, with the same technical characteristics, the emissions of electric vehicles will be significantly higher. In China, the dominance of carbon-intensive coal-fired power generation means that EV emissions are always higher than those of combustion engine vehicles. With the Chinese government planning to peak coal power generation around 2025, emissions from China’s electric power sector will certainly remain high for the next decade. The Chinese EV market remains the largest in the world, so the overall promotion of EVs is leading to an overall increase in global greenhouse gas emissions. As China’s electric power sector decarbonizes and shifts to new types of batteries that come with fewer emissions during their production and disposal, EVs’ greenhouse gas emissions will reduce. China is still only building the industry and infrastructure needed for the energy transition. At the same time, EV sales in Europe as a whole are stagnating due to the reduction of government support in Norway and the end of subsidies in Germany.
Keywords
About the author: Mikhail V. SINITSYN, Researcher, Center for Energy Research.
Competing interests: no potential competing financial or non-financial interest was reported by the author.
Funding: no funding was received for conducting this study.
For citation: Sinitsyn M.V. Life-Cycle Greenhouse Gas Emissions: Battery Electric and Internal Combustion Engine Vehicles. Analysis and Forecasting. IMEMO Journal, 2025, no. 3, pp. . DOI: 10.20542/afij2025-3- EDN: NEQGDY
For citation:
Sinitsyn M. Life-Cycle Greenhouse Gas Emissions: Battery Electric and Internal Combustion Engine Vehicles. Analysis & Forecasting. IMEMO Journal, 2025, no 3, pp. 25-35. https://doi.org/10.20542/afij-2025-3-25-35
INTRODUCTION
The widespread use of electric vehicles in road transport, along with the promotion of renewables in the power industry, is the main direction of the energy transition. Since 2019, electric vehicles sales have accelerated: in absolute terms increased by 6.6 times in 2019–2023 and exceeded 13.8 million units in 2023, in 2024 sales reached 17.1 million units (Fig. 1). China, Europe and the United States remain the main markets, accounting for 93% of global sales of light electric vehicles, with China alone accounting for more than half. In Europe around 3.2 mln electric cars were sold in 2024 – fewer than the year before, due to the end of purchase subsidies in Germany in December 2023 and the winding down of state support in Norway: from January 2023, owners of electric cars must pay road tax, and tax breaks for dealers have been reduced. Despite the introduction of German national emissions trading system (nEHS) covering petroleum products in the transport sector, where the price of a ton of CO2 reached US$45 in 2024 1, electric vehicles remain uncompetitive without stimulating government support.
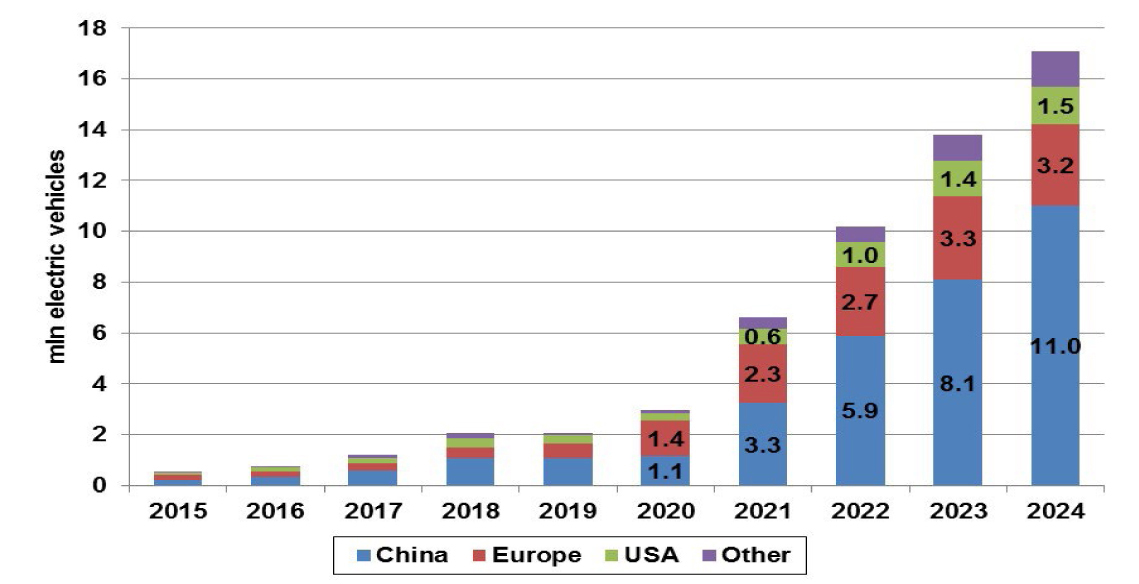
Sources: based on the data of IEA and evboosters.com.
LITERATURE REVIEW
The issue of assessing greenhouse gas (GHG) emissions is highly relevant due to the rapid growth of the electric vehicle market and the policy of government regulators to build a low-carbon paradigm of economic growth. A large number of studies are devoted to assessing GHG emissions during the life cycle of batteries (a review of studies is presented in 2), during the production of electric vehicles and vehicles with internal combustion engines (ICE) and their operation in China (for a review of studies, see 3 4), India 5 and Europe (see 6). A review of the most recent studies is presented in 7 8. An assessment of greenhouse gas emissions taking into account forecasts for changes in the structure of electricity generation for the largest countries in the world in 2030 is carried out in 9.
The overall conclusion of the abovementioned studies is that the production of an electric vehicle is associated with higher GHG emissions than a traditional internal combustion engine vehicle, due to the high energy and carbon intensity of battery production and the mining and production of the metals they are made of. Greenhouse gas emissions can only be offset by electricity generation being less carbon intensive than petroleum products. In European countries, due to the promotion of low-emission sources (primarily renewables), emissions in the power industry are low enough (especially in Norway) to offset GHG emissions from battery production. In China, greenhouse gas emissions from electric vehicles are currently higher than those from ICEV. However, taking into account the forecast for changes in the power generation structure, even in China, emissions from electric vehicles, excluding battery recycling, will be 37% lower than those from internal combustion engine vehicles. Emissions from the production of small electric vehicles are lower (they grow non-linearly quickly with the increase of battery size) than those of mid-size ICE vehicles. Taking into account lower electricity consumption with a small battery, emissions from electric vehicles will be lower even with a relatively high share of coal generation in China as a whole (with recycling 4) or in individual Chinese provinces 10. Studies in Brazil have shown that, due to the use of ethanol, Flexible Fuel Vehicles produce fewer GHG emissions over the life cycle than electric vehicles even with low-emission power generation 11.
The vast majority of studies traditionally assume that a vehicle is used for 8-10 years (total mileage of 150 thousand km) 7, but in developed countries the average service life of a car has increased rapidly in recent decades, for example, in the USA it has grown from 8 years in 1995 to 13 years in 2022. It is advisable to consider the option of longer operation – with a mileage of up to 200 thousand km, but in this case greenhouse gas emissions will be higher, since the battery will need to be replaced and disposed. Disposal involves disassembling the car and battery and recycling the materials. The energy consumption (and, therefore, emissions) for disassembling an electric car and a traditional car are approximately equal 10, and electricity, coal and natural gas for recycling battery materials greatly depend on its type and recycling method. The dominant NMC battery is being replaced by LFP, and sodium-ion and solid-state batteries are developing rapidly.
Comparison of emissions should be made for vehicles with identical technical characteristics, such as the VW Golf and eGolf 6, but there are no such analogues for most electric vehicles. Moreover, in terms of the most important parameter – the average range – electric vehicles are significantly inferior to traditional cars. According to the International Energy Agency (IEA), in 2019–2023, the average range of electric vehicles increased only from 297 km to 338 km, which is less than both the value desired by buyers and the average mileage of a car with an internal combustion engine (Fig. 2). In 4, BYD Qin is compared: an electric vehicle with a range of up to 90 km and a car with a range of up to 800 km, in 10 BYD Qin with a range of up to 90 km and Volkswagen Lavida with a range of up to 845 km. The problem of comparison by technical characteristics can be solved by using special integral indicators, such as in 12. This study shows that in Norway, the trend greenhouse gas emissions of EVs are lower than those of non-EVs, while in the UK they are similar.
Figure 2. Cruising Range of Battery, km
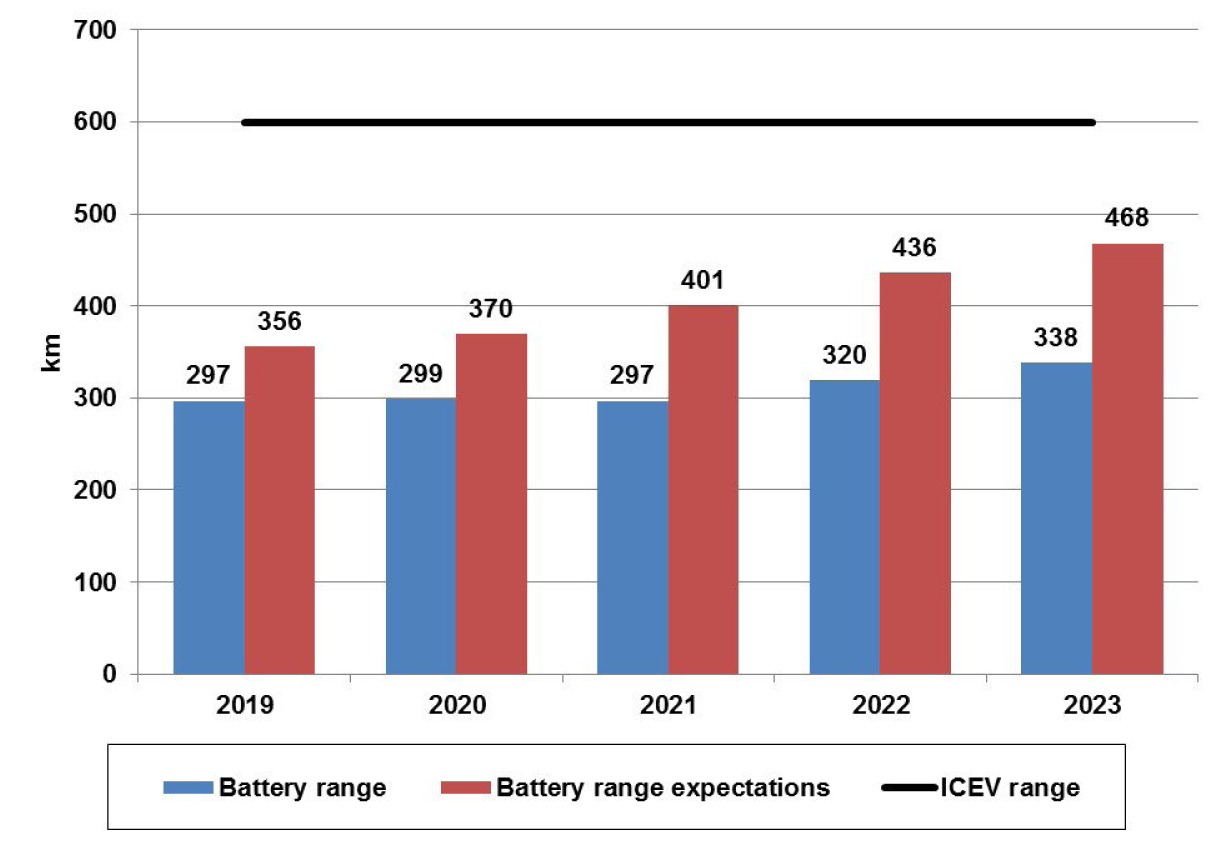
Sources: based on the data of IEA, McKinsey and World Economic Forum .
METHODOLOGY
The methodology is based on the algorithm proposed by 12: vehicles are compared by the integral indicator and emissions during the life cycle. SRPR (Square Root of Power and Range), which takes into account engine power and range (critical for buyers of electric cars) 12, was chosen as the integral indicator of the technical characteristics of cars for the study:
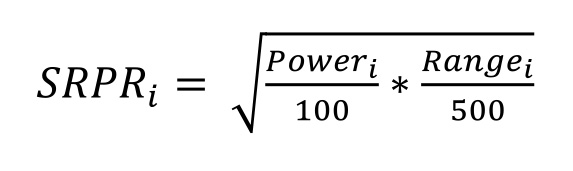 (1)
(1)where SRPRi – Square Root of Power and Range vehicle i, Poweri – engine power, Rangei – range.
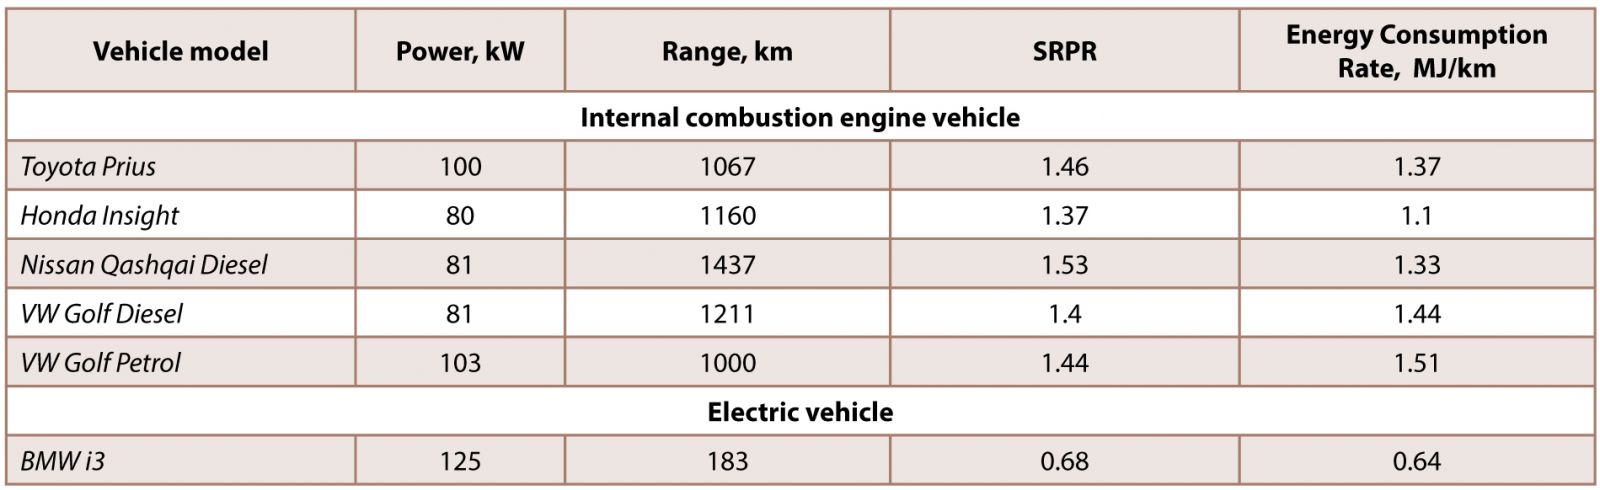
Sources: author’s estimates based on the data of 12, drom.ru (VW Golf Petrol).
Vehicles are compared based on GHG emissions per kilometer travelled (2). Life-cycle GHG emissions are calculated as the sum of emissions from production, vehicle operation (combustion of petroleum fuels / power generation mix), battery replacement and disposal (3).
EmissionPerKmij=TotalEmissionsijRangei (2)
TotalEmissionsij=ProductionEmi+FuelEmij+ReplacementEMiBEV
+MaintenaceEmiICEV+UtilisationEmi (3)
FuelEmij=Rangei*FuelConsumptionijm*FuelEmissionij (4)
FuelConsumptionijBEV=FuelConsumptioni*(1+Lossesj+
+ChargeLossesi) (5)
FuelConsumptionijICEV= FuelConsumptionij (6)
FuelEmissionij=Emissionjn/Consumptionjn (7)
where EmissionPerKmij – all life CO2 emission rate vehicle i in state j, g/km, TotalEmissionsij – all life CO2 emission, ProductionEmi – production emissions, FuelEmij – emission rate from combustion of petroleum fuels / power generation mix, ReplacementEmiBEV – emissions from replacing an electric vehicle battery, MaintenaceEmiICEV – ICEV maintenance emissions, UtilisationEmi – disposal emissions, Rangei – range, FuelConsumptionijm – energy rate BEV or ICEV, Lossesj – losses in power grids (%), ChargeLossesi – electric vehicle charging losses (%), FuelEmissionij – CO2 fuel emission rate from combustion of petroleum fuels / power generation mix, Emissionjn – CO2 fuel emission, Consumptionjn – fuel consumption.
Greenhouse gas emissions from vehicle production, fuel consumption per km traveled and losses during charging of electric vehicles are taken from 12 (emissions from production of VW Golf Petrol and VW Golf Diesel, replacement and disposal of batteries for these vehicles are equal, only fuel consumption and emissions associated with it differ). With a mileage of 150 thousand km, battery replacement is not required, with a mileage of 200 thousand km, the battery is changed on an electric vehicle (40% of emissions from production of an electric vehicle 6, but taking into account a secondary use – 31%), emissions from servicing vehicles with an internal combustion engine are estimated on average as one ton of CO2 3. Emissions from disposal are 7% for electric vehicles and 10% for vehicles with an internal combustion engine 4. Losses in networks, emissions from combustion of oil fuels / electricity generation are calculated based on IEA energy balance data and IEA greenhouse gas emissions.
Greenhouse gas emissions from the power sector are critical for assessing the life-cycle emissions of electric vehicles. Over the past 20 years, countries leading the energy transition have been able to achieve a significant reduction in the carbon intensity of power generation (Fig. 3). The lowest emission rates are in the EU power sector, although the post-pandemic crisis, when rapid economic recovery and low output in wind and hydro generation coincided, led to an increase in coal generation and an increase in emissions.
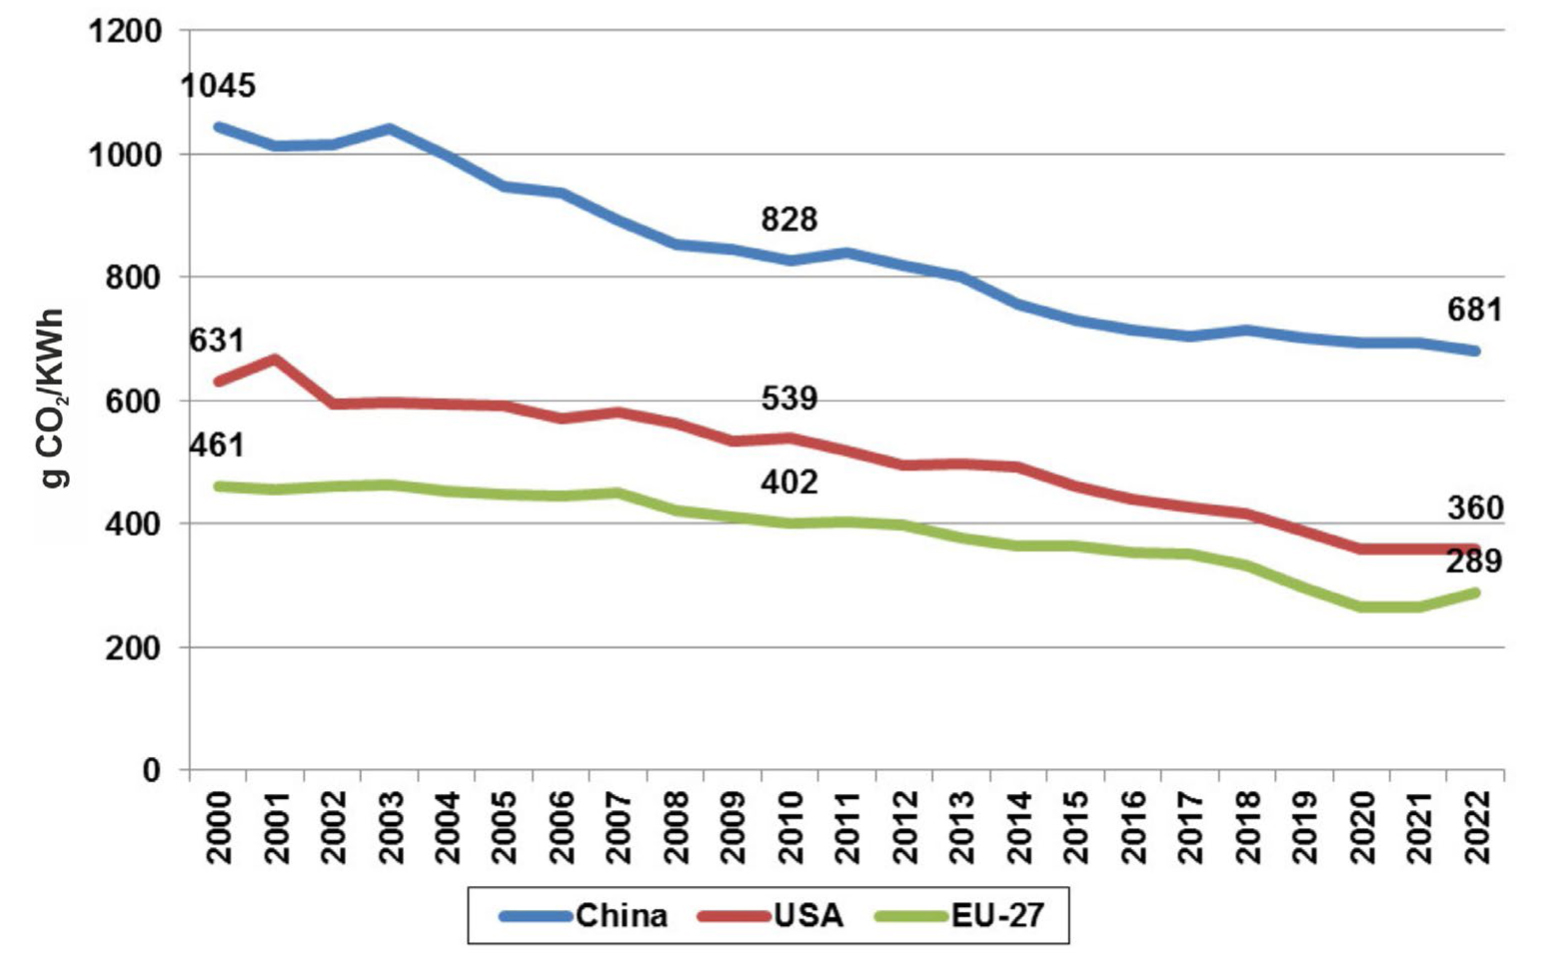
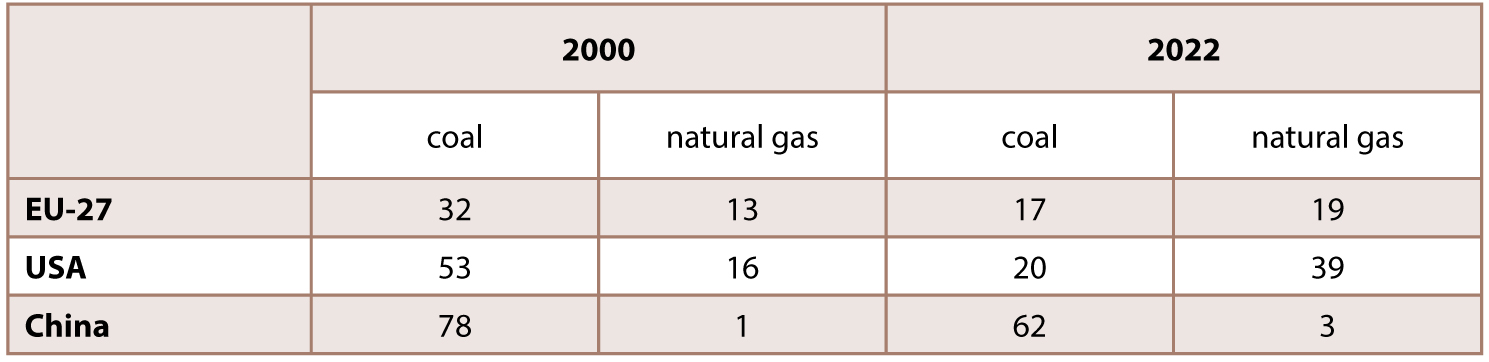
The universal driver of decarbonization of the power industry is the reduction of coal generation, but in the EU countries it is being displaced by generation from renewables, and in the USA – by gas. In China, coal continues to dominate the power industry (Table 2).
RESULTS
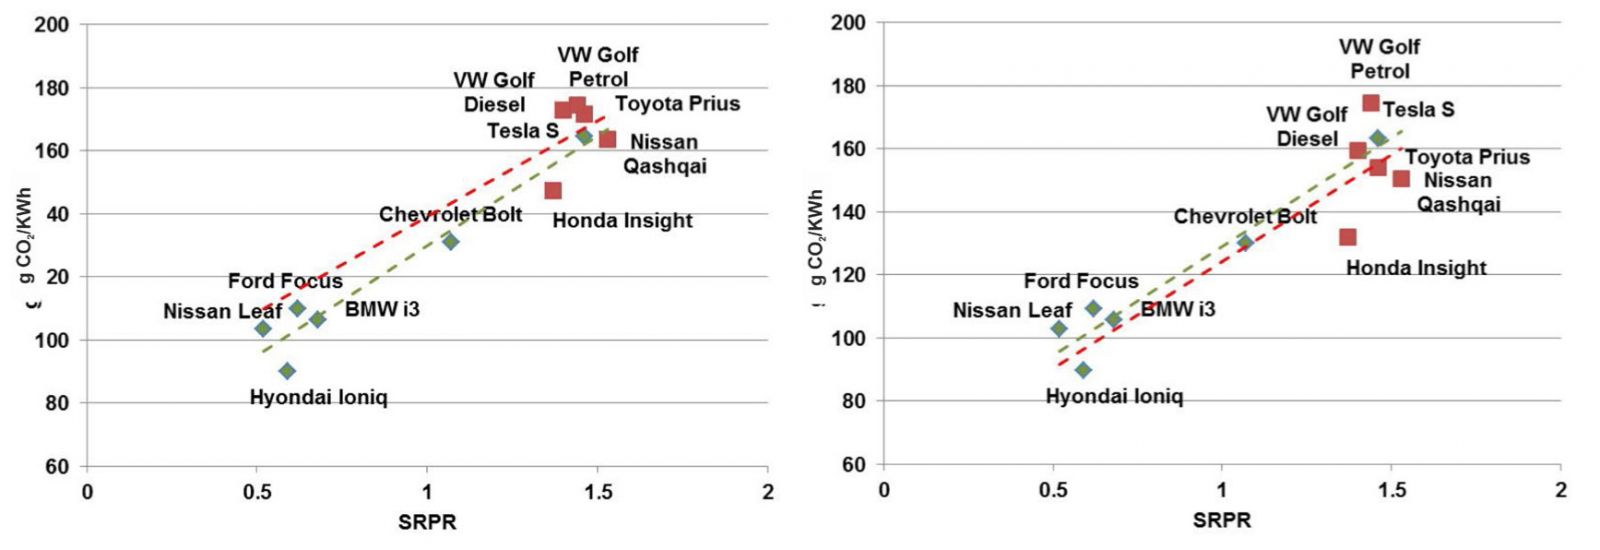
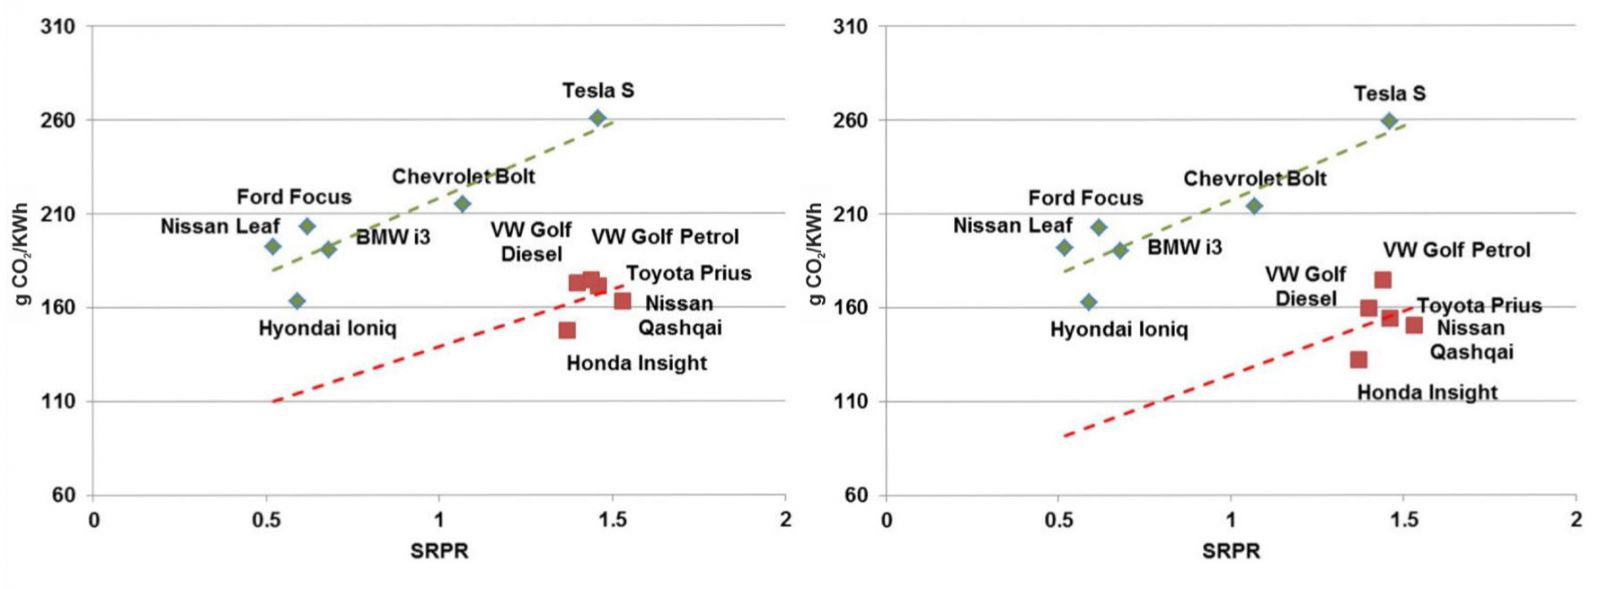
The assessment of the integral SRPR indicator shows that electric vehicles are inferior in technical characteristics to ICEV, with the exception of Tesla (Table 1, Figs. 4–7). Therefore, the comparison will be performed in four cases: a comparison of GHG emissions of electric vehicles and ICEV with a mileage of 150 thousand km and 200 thousand km directly and with a mileage of 150 thousand km and 200 thousand km taking into account technical characteristics (according to the trend indicator).
In the EU, all electric vehicles except Tesla have lower life-cycle greenhouse gas emissions (Fig. 4). It should be noted that in 2016, in the UK, with slightly higher emissions in the power industry than in the EU-27, the trend values of life-cycle greenhouse gas emissions for electric vehicles were almost the same as the trend values for electric vehicles 12. Due to the power industry decarbonization, electric vehicles produce fewer emissions over a mileage of 150 thousand km compared to similar ICEV. Taking into account the replacement and disposal of batteries, the trend value of electric vehicle emissions is higher.
Sources: author’s estimates.
In the U.S., all electric vehicles have lower life-cycle GHG emissions except for Tesla at 150 thousand km, along with Tesla and Chevrolet at 200 thousand km (Fig. 5). The trend value of GHG emissions over the life cycle of electric vehicles is higher than that of similar ICEV in all cases. It should be noted that the GHG emissions of the gasoline VW Golf are higher than those of the diesel due to its higher fuel consumption, and it is second only to Tesla in emissions.
Sources: author’s estimates.
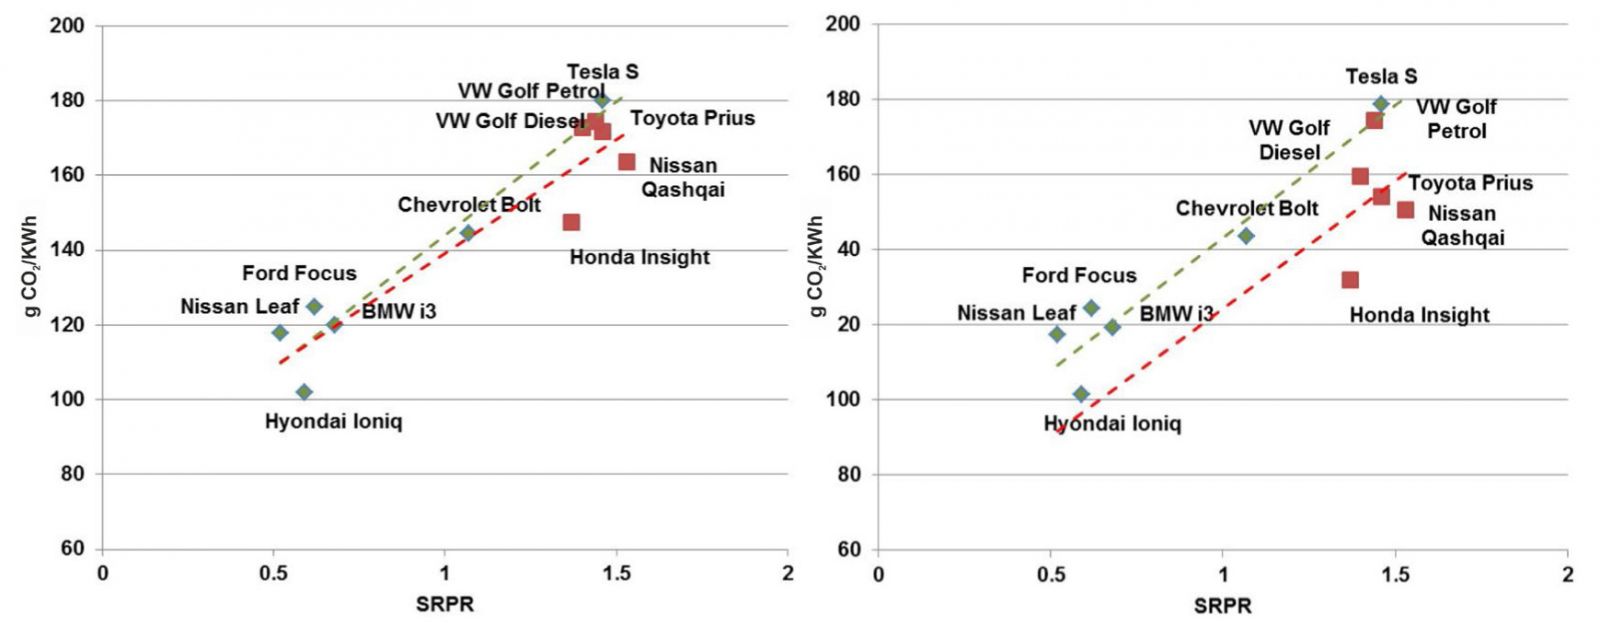
In China, life-cycle greenhouse gas emissions of electric vehicles are significantly higher, with the exception of Hyundai, even without taking into account battery replacement and disposal, due to the dominance of coal-fired power generation (Fig. 6).
Sources: author’s estimates.
To assess the sensitivity of the modeling results to changes in battery production and recycling technologies and the carbon intensity of power generation, a scenario for China in 2030 was calculated. The carbon intensity of electricity generation will decrease from 681 to 549 g CO2/kWh (the IEA Current Policies scenario), and the volume of emissions from battery production and recycling will decrease by 26%. In 2030, life-cycle GHG emissions over a mileage of 150 thousand km will be lower for all electric vehicles except Tesla and Chevrolet, but their trend values for electric vehicles will still be higher (Fig. 7).
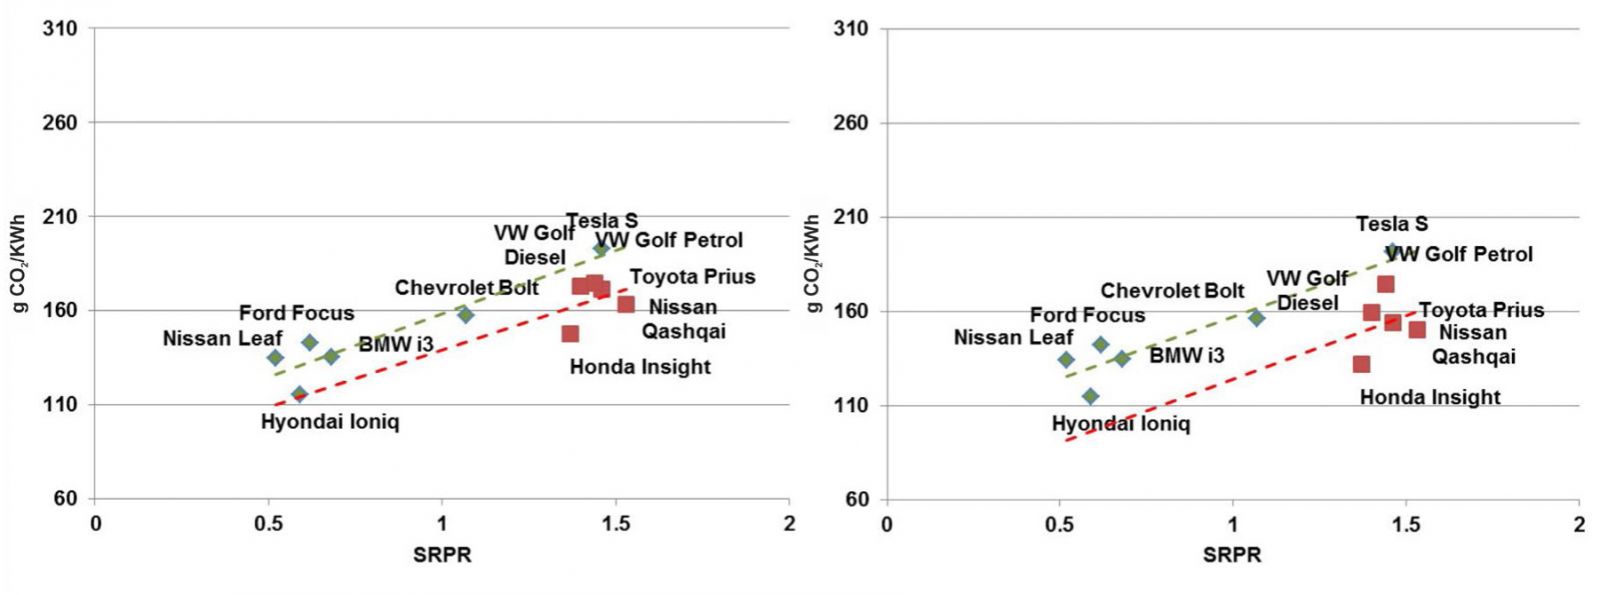
Sources: author’s estimates.
In order to achieve parity in greenhouse gas emissions from electric vehicles and internal combustion engine vehicles, China needs to significantly reduce the carbon intensity of its power generation. Coal-fired power generation in China is projected to peak around 2025, and the volume of coal-fired power generation capacity under construction and declared is enormous 13, so the necessary reduction in carbon intensity will only be achieved around 2035 (IEA Current Policies scenario). Before that, the promotion of electric vehicles in China will be associated with higher emissions than the use of traditional internal combustion engine vehicles. Support for the automotive industry is part of China’s economic policy to develop national industry and encourage commodity exports 14, so climate aspects are relegated to the background. Currently, the PRC is creating the industry and infrastructure necessary for the energy transition.
CONCLUSION
Life-cycle greenhouse gas emissions are a key indicator for justifying public policy to stimulate electric vehicles sales as part of the energy transition. They are higher for gasoline cars than for diesel cars, and for cars with only an internal combustion engine – than for hybrids. Emissions from electric cars in the EU and the U.S. are generally lower than those of cars with an internal combustion engine. In the EU, emissions will be lower even when considering battery replacement and disposal with a total mileage of 200 thousand km. However, in terms of technical characteristics, electric cars are inferior to traditional cars; the trend emission indicator is higher for electric cars than for similar cars with ICE. In the U.S., the carbon intensity of power mix is low enough that electric vehicles reduce emissions without taking into account battery replacement and recycling, but not enough when accounting the latter. In China, coal-fired power generation comprises more than 60% of total electricity generation, so electric vehicle emissions are higher than those of internal combustion engine vehicles. Coal-fired power generation will remain dominant over the next decade, so GHG emissions will remain elevated. China’s electric vehicles market remains the largest in the world, so overall, the promotion of electric vehicles will lead to global GHG emissions growth in the medium term. China is still building the industry and infrastructure for the energy transition. As China decarbonizes its power sector and switches to new types of batteries that produce lower emissions during production and recycling, electric vehicles will subsequently reduce GHG emissions.
References
- Sinitsyn M.V., Illeritskiy N.I. Development of a National Emissions Trading System in Germany: Financial and Strategical Goals. Contemporary Europe, 2024, no. 7, pp. 124-133. (In Russ.). DOI: 10.31857/S0201708324070106
- Aichberger C., Jungmeier G. Environmental Life Cycle Impacts of Automotive Batteries Based on a Literature Review. Energies, 2020, no. 13(23), 6345. DOI: 10.3390/en13236345
- Yang L., Yu B., Yang B., Chen H., Malima G., Wei Y. Life Cycle Environmental Assessment of Electric and Internal Combustion Engine Vehicles in China. Journal of Cleaner Production, 2021, no. 285, 124899. DOI: 10.1016/j.jclepro.2020.124899
- Shang H., Sun Y., Huang D., Meng F. Life Cycle Assessment of Atmospheric Environmental Impact on the Large-Scale Promotion of Electric Vehicles in China. Resources, Environment and Sustainability, 2024, no. 15, 100148. DOI: 10.1016/j.resenv.2024.100148
- Joshua R.K.A., Subramanian K.A. Comparative Performance and Emission Analysis of Internal Combustion Engine and Battery Electric Vehicle Under Modified Indian Drive Cycle. Process Safety and Environmental Protection, 2024, no. 190, Part B, pp. 211-220. DOI: 10.1016/j.psep.2024.08.053
- Klimabilanz von Elektroautos. Agora. 2019. Available at: https://www.agora-verkehrswende.de/fileadmin/Projekte/2018/Klimabilanz_von_Elektroautos/Agora-Verkehrswende_22_Klimabilanz-von-Elektroautos_WEB.pdf (accessed 04.04.2025).
- Xia X., Li P., Xia Z., Wu R., Cheng Y. Life Cycle Carbon Footprint of Electric Vehicles in Different Countries: A Review. Separation and Purification Technology, 2022, no. 301, 122063. DOI: 10.1016/j.seppur.2022.122063
- da Costa V.B.F., Bitencourt L., Dias B.H., Soares T., de Andrade J.V.B., Bonatto B.D. Life Cycle Assessment Comparison of Electric and Internal Combustion Vehicles: A Review on the Main Challenges and Opportunities. Renewable and Sustainable Energy Reviews, 2025, no. 208, 114988. DOI: 10.1016/j.rser.2024.114988
- Shafique M., Luo X. Environmental Life Cycle Assessment of Battery Electric Vehicles from the Current and Future Energy Mix Perspective. Journal of Environmental Management, 2022, no. 303, 114050. DOI: 10.1016/j.jenvman.2021.114050
- Tang B., Xu Y., Wang M. Life Cycle Assessment of Battery Electric and Internal Combustion Engine Vehicles Considering the Impact of Electricity Generation Mix: A Case Study in China. Atmosphere, 2022, no. 13, 252. DOI: 10.3390/atmos13020252
- Lavrador R.B., de Sá Teles B.A. Life Cycle Assessment of Battery Electric Vehicles and Internal Combustion Vehicles Using Sugarcane Ethanol in Brazil: A Critical Review. Cleaner Energy Systems, 2022, no. 2, 100008. DOI: 10.1016/j.cles.2022.100008
- Zheng G., Peng Z. Life Cycle Assessment (LCA) of BEV’s Environmental Benefits for Meeting the Challenge of ICExit (Internal Combustion Engine Exit). Energy Reports, 2021, no. 7, pp. 1203-1216. DOI: 10.1016/j.egyr.2021.02.039
- Sinitsyn M.V. End of Energy Coal Era. World Economy and International Relations, 2021, vol. 65, no. 11, pp. 40-48. (In Russ.). DOI: 10.20542/0131-2227-2021-65-11-40-48
- Zhukov S.V., Maslennikov A.O., Reznikova O.B., Sinitsyn M.V. U.S. Protectionism Against China’s Mercantilism. World Economy and International Relations, 2024, vol. 68, no. 11, pp. 15-28. (In Russ.). DOI: 10.20542/0131-2227-2024-68-11-15-28